Lead Trends Dashboard (Clickable)
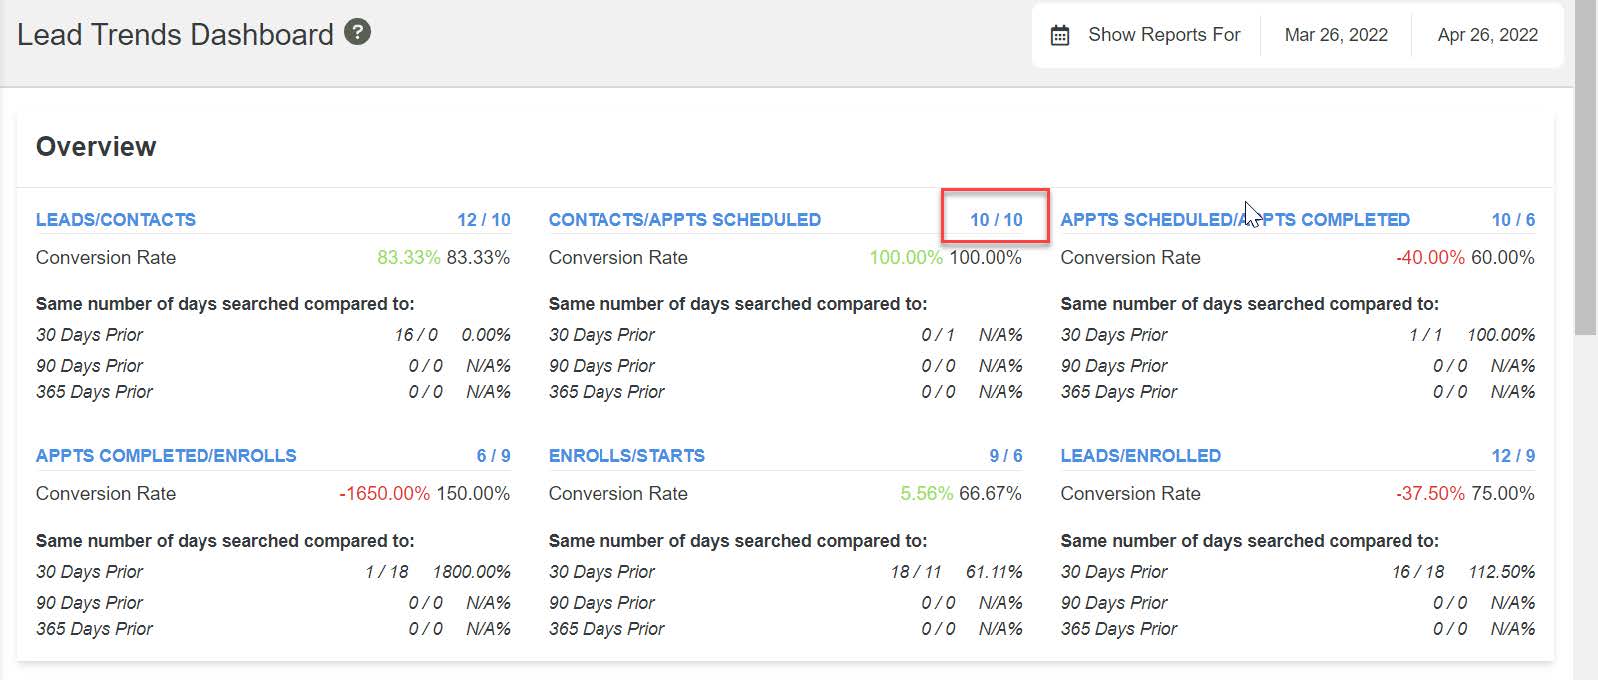
Users can dig deeper into the lead trends dashboard numbers. You can click on any of the Blue headers [example – “Leads/Contacts”]. This will open up a pop up that will help you drill deeper into the conversion rates.
Step 1:
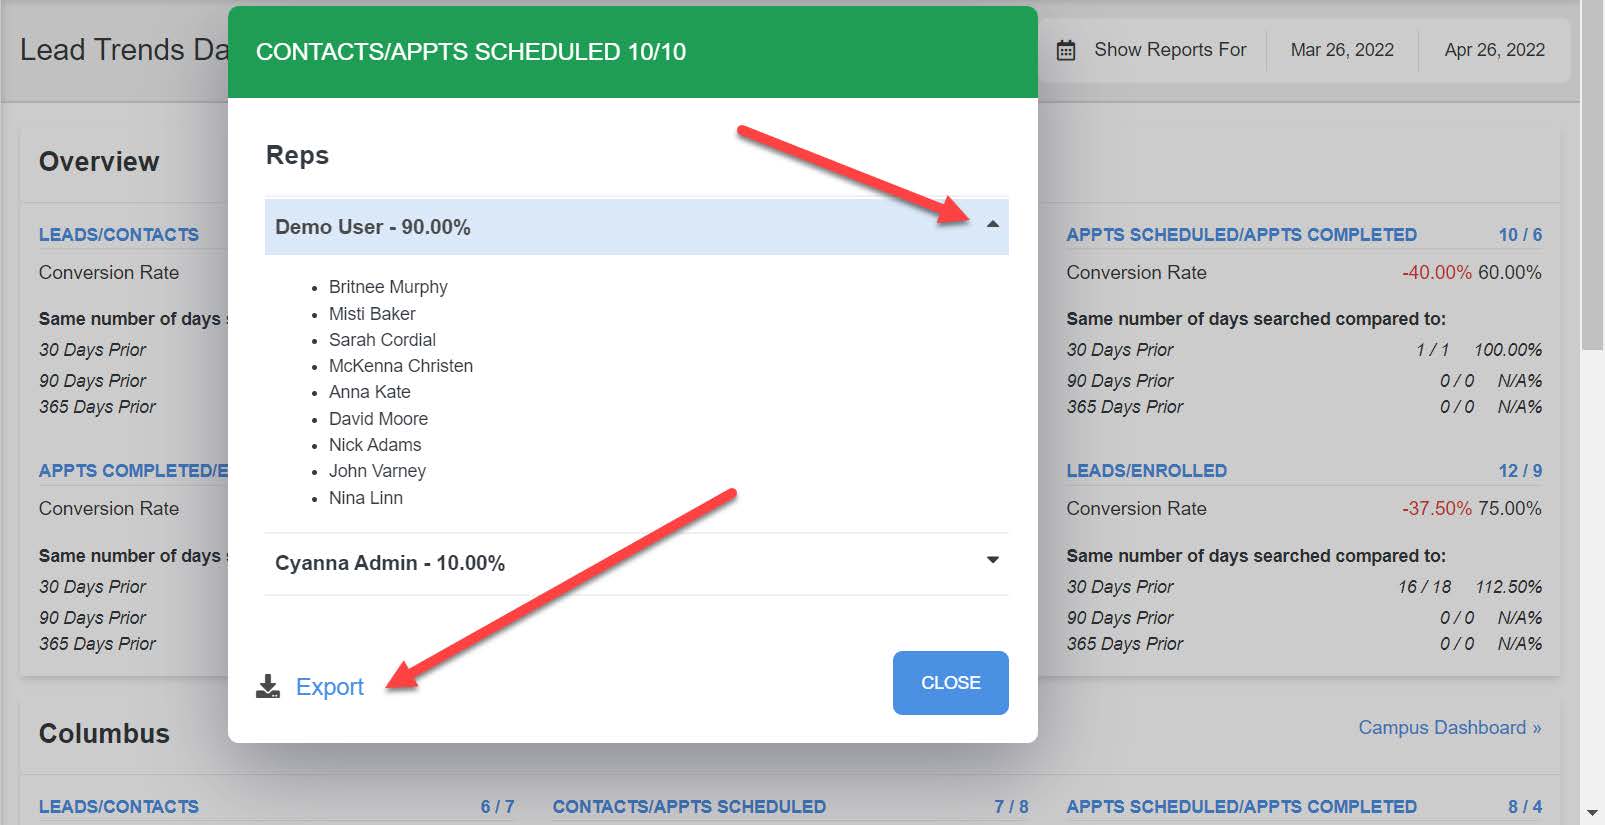
The first popup will have the following:
- Names of each of the reps who are responsible for that conversion. The respective % that contributes toward that conversion rate. For example, if Rep 1 has made 5 conversions of the total of 10, his/her share will be 50% towards the conversion rate.
Step 2:
- Click on each User name to expand and see their contributions: Users can click on the names of any reps to dropdown the leads who have been converted.
- This list can also be exported by clicking on the “Export” button on the bottom left hand corner, allowing the user to manipulate the data further if needed.
User Reports

Rep Activities Timeline
- This report shows a timeline of activities performed by individual users over a period of time on EDlumina’s CRM.
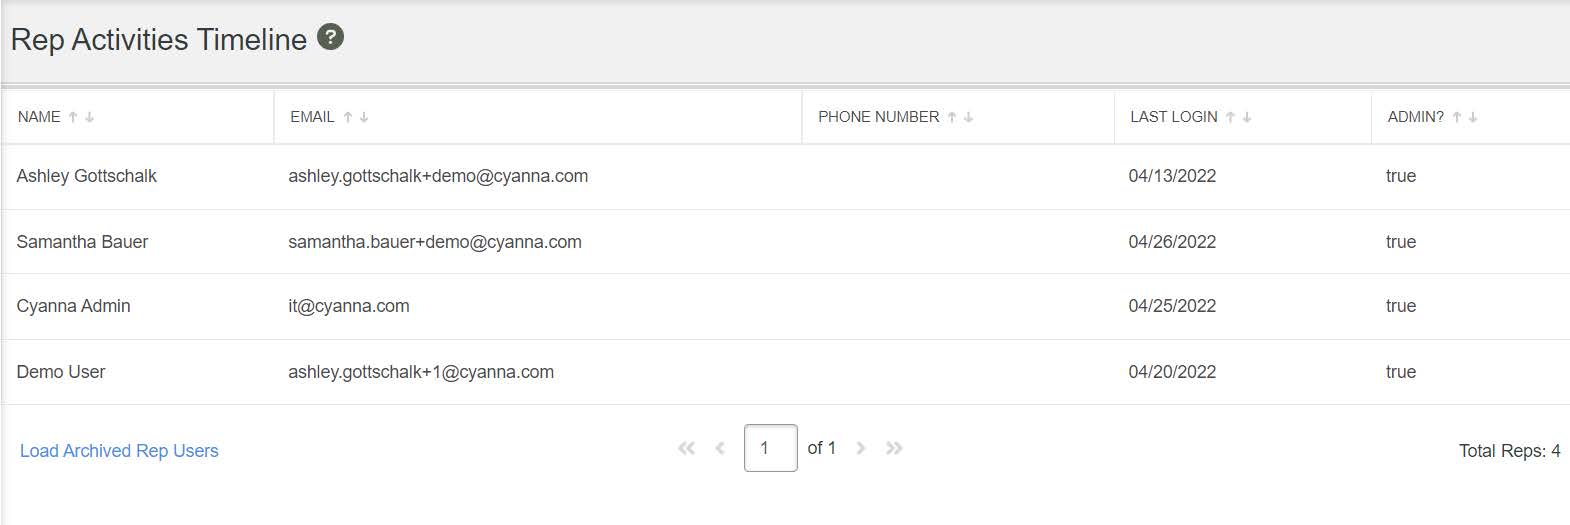
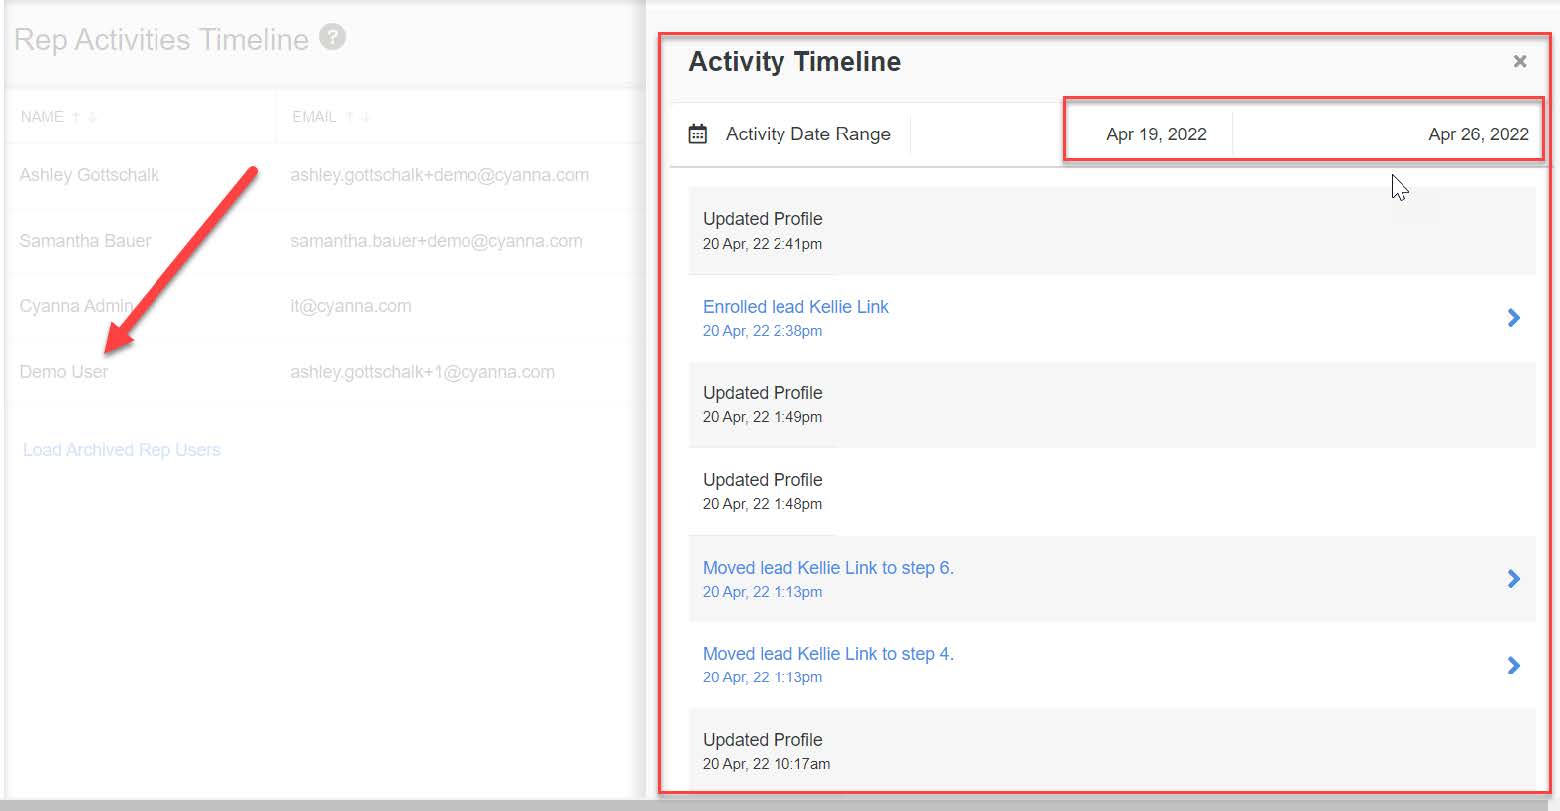
- In order to see the activity performed by the users of your organization, simply click on the names of any of the users. This will generate a fly out from the right side of your screen which will have timestamps and details as to what activity was performed by the selected user.
- You can also customize the date range between which you want to view user activity. In order to do so, simply manipulate the date range selection box on the fly out that is generated per user.
NOTE: Since this report was launched by the Edlumina team on 4/19/2022, the timeline of activities that are recorded on the platform only goes back to 4/19/2022.
User Metrics Report
This report shows you the key metrics or the KPIs that EDlumina now tracks for the Users of your organization. You can see the following metrics recorded on EDlumina:
- Leads Assigned
- Leads Added
- Messages Sent
- Hot Leads Marked
- Leads Closed
- Steps Moved
- Events Scheduled
- Enrollments Marked
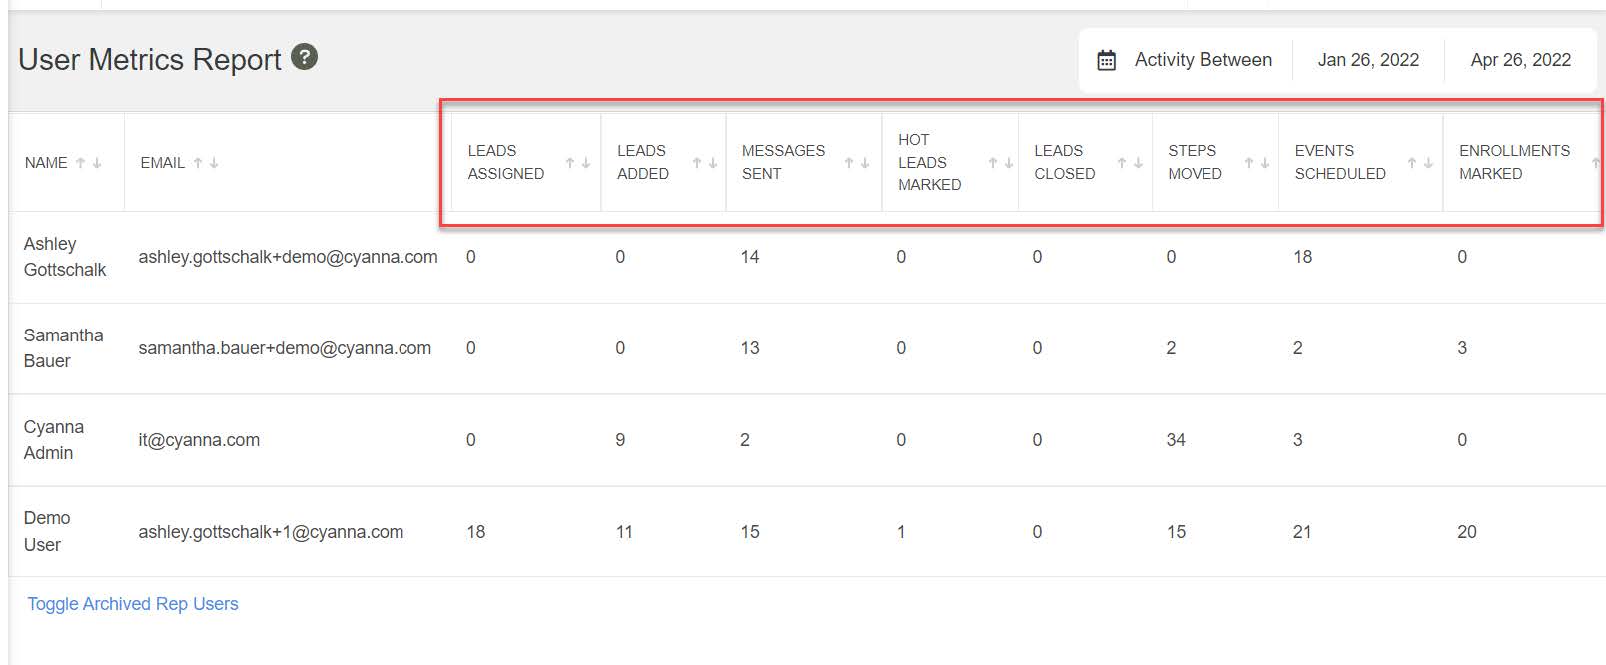
- You can also arrange the User rankings in ascending or descending order by clicking on the reordering arrows on the names of each column. In addition to that, you can also select the date range for when you want to see the user metrics to be reported. This can be done via the input boxes on the top right side of your screen.
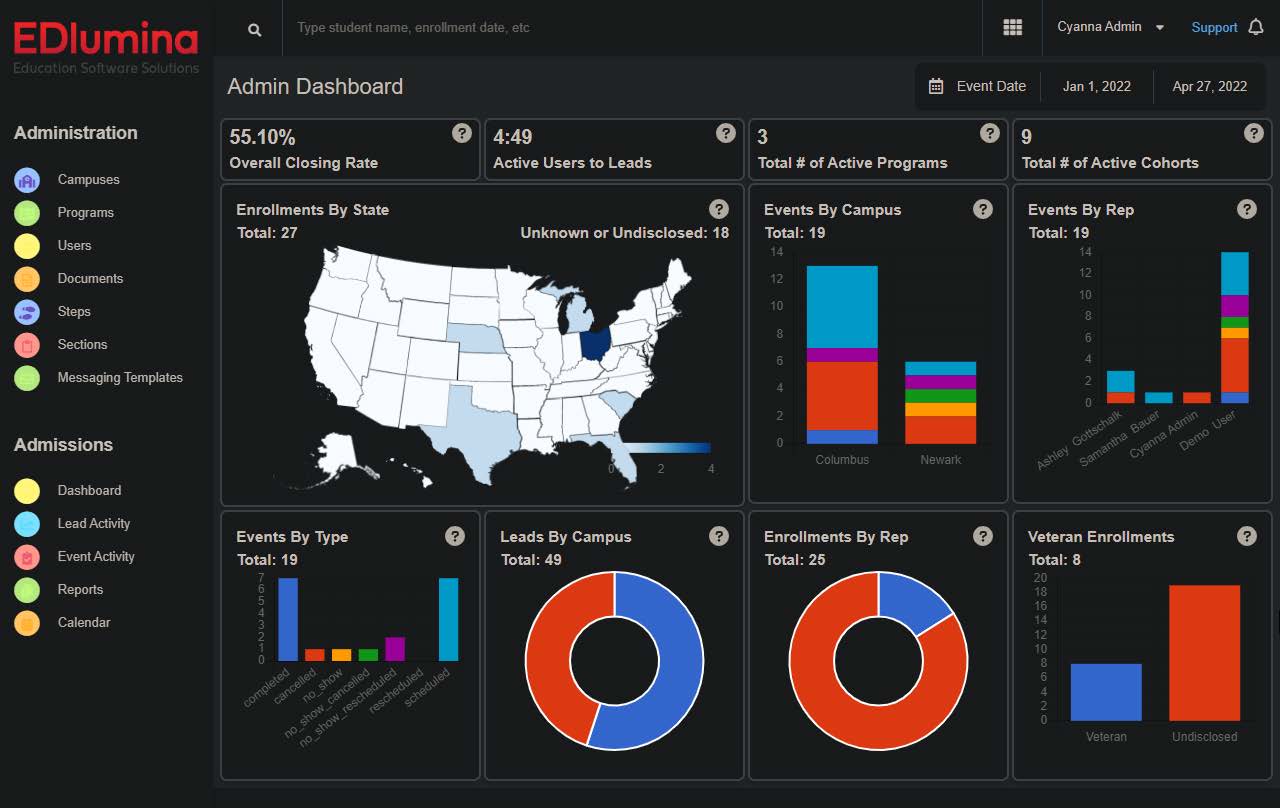
Dark Mode Option
Go to your “User Profile” from the top right dropdown on your EDlumina screen to flip between dark & light modes.

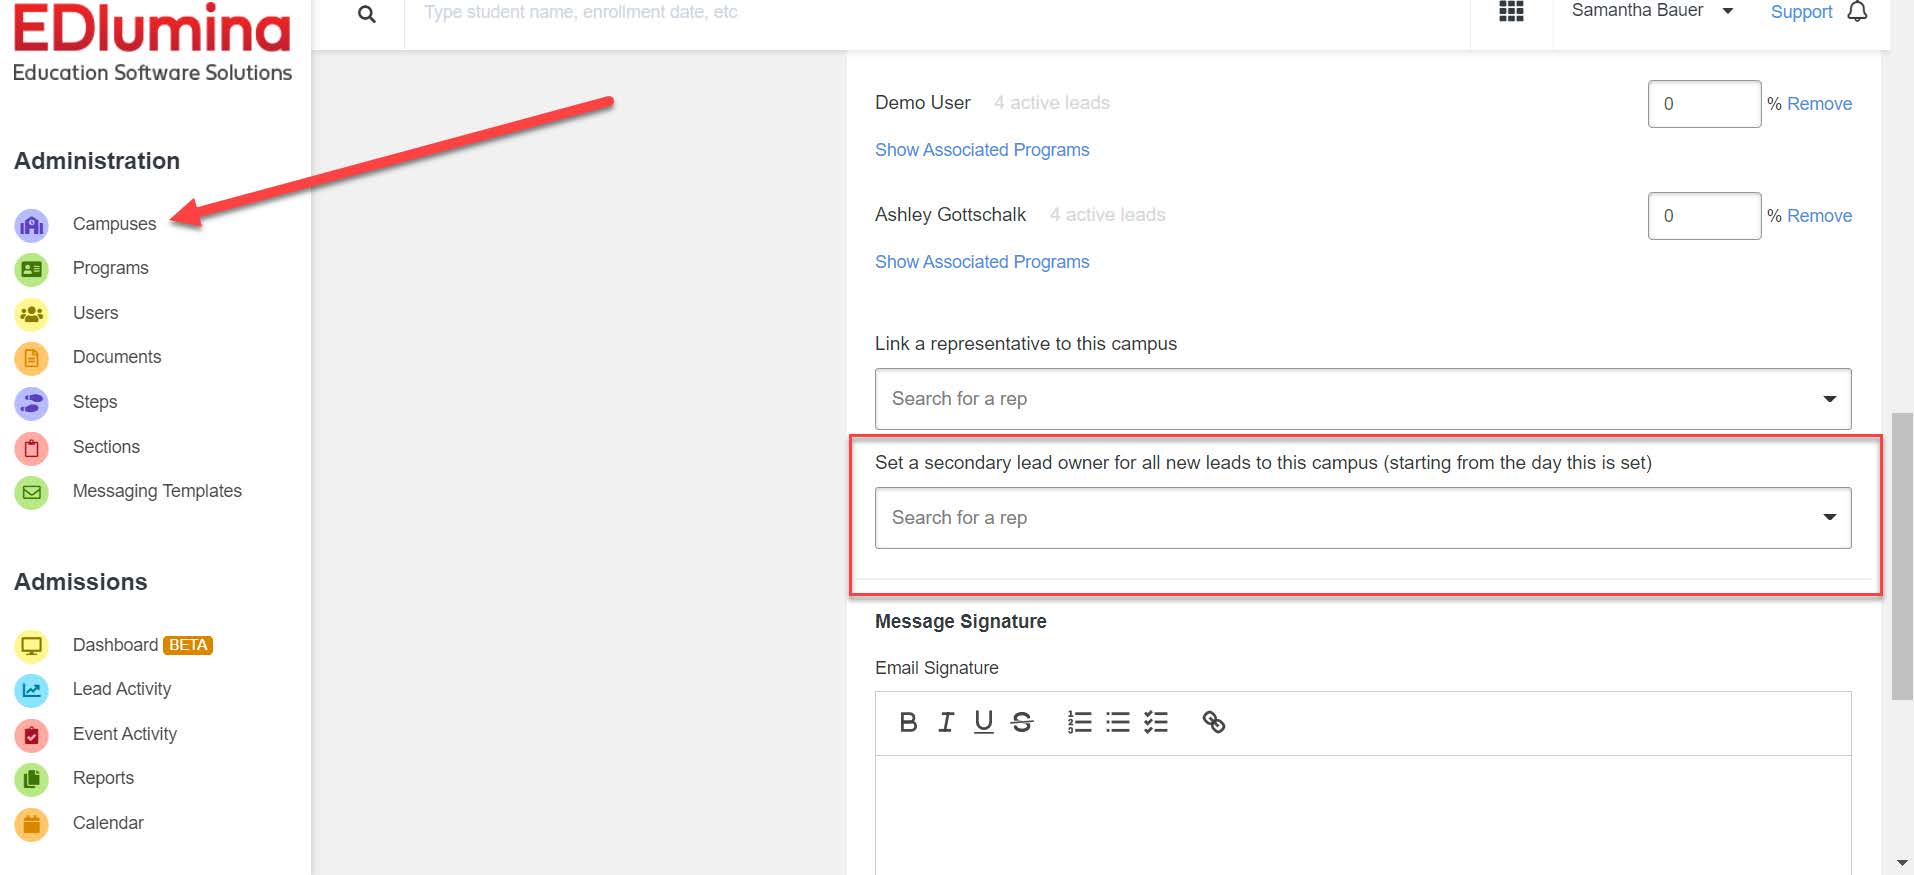
Auto Assign Secondary Lead Owner
Admins can now automatically assign a secondary lead owner by Campus. When a new lead comes in for that Campus, EDlumina alerts the Lead Owner and Secondary Lead Owner of any activity that happens with this lead.
Lead to Enroll Averages Reports

Lead to Enroll by Campus
This report shows the average # of days between “Lead-in” to when the lead was “Enrolled” for a particular campus. The details on the report include:
- # of active reps on each campus
- Total # of enrollments for each campus
- Date when the last enrollment was marked for each campus
- Average days between Lean-in and Enrollment for all leads, per campus.
Additionally, users can also wrangle the data in the columns for the reporting table. This can be done by clicking on the reorder arrows on the name of each individual column.
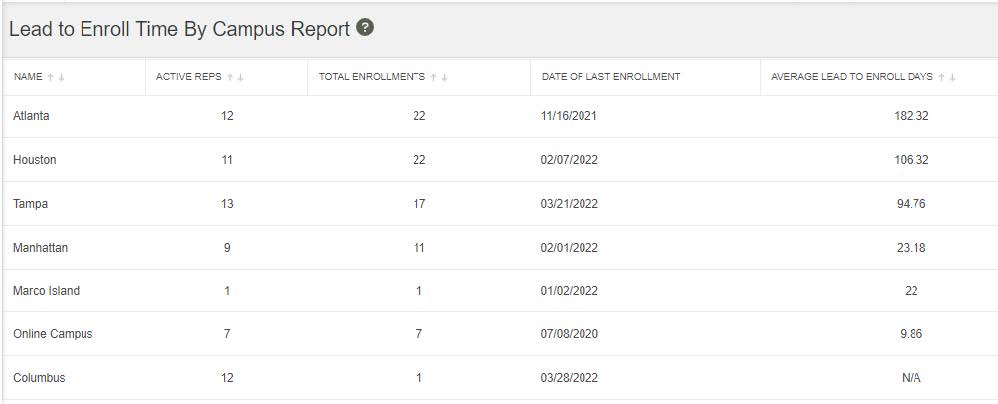
NOTE: For any Campus that either has no enrollments marked, or has no associated data points, the table cells will have an N.A. noted within it.
Lead to Enroll by User (Rep)
This report shows the average number of days it takes each user to enroll their leads. For each user, the table intends to show the average # of days that have lapsed between when there was a “Lead-in” to when the user marked the lead as “Enrolled”. The table has the following data points for each user:
- Name of User
- Email of User
- Phone # of User
- Campuses the User belongs to
- Whether or not the User has admin access
- Date of last log-in for the User
- Average # of days between lead-in and enrollment per User, for all their leads
Additionally, users can also wrangle the data in the columns for the reporting table. This can be done by clicking on the reorder arrows on the name of each individual column.
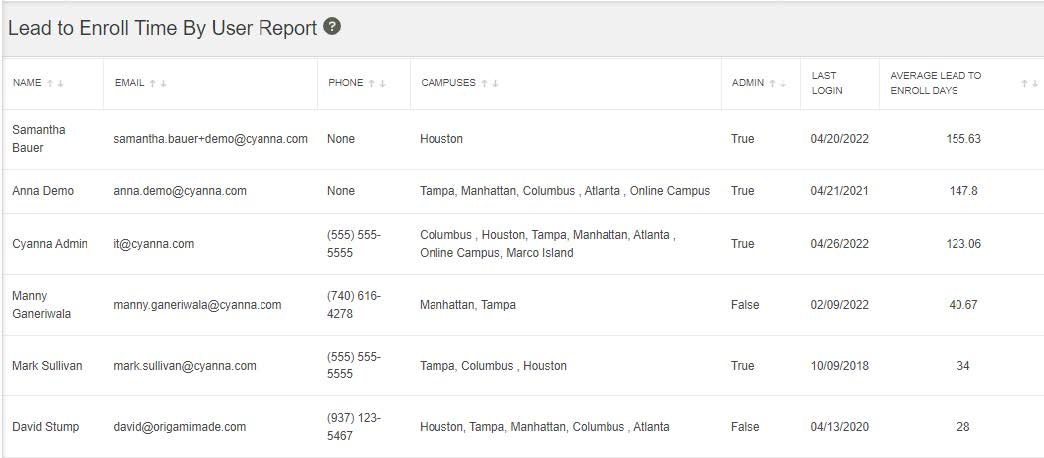
NOTE: For any User that either has no enrollments marked, or has no associated data points, the table cells will have an N.A. noted within it.
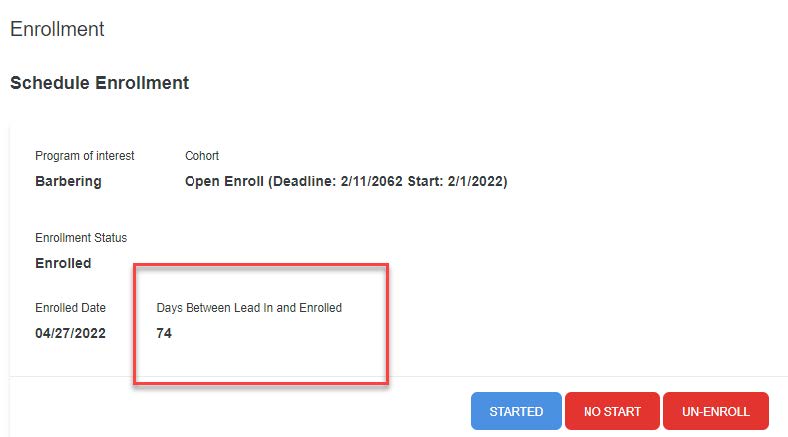
Lead to Enroll by Lead
You can now see how many days a lead is converted from Lead to Enroll within the Lead Profile Page under Enrollment.